Core Business Intelligence Development Services
The reporting layer that sits on your data platform, built so people trust the numbers and actually use what we ship.

Dashboard development
The dashboards your team runs decisions on, built in Power BI, Tableau, or Looker. We design for the question being asked, not for how many charts fit on a screen, so people find the answer instead of scrolling past it.
- Built around the decision, not the chart count
- One agreed number per metric, no dueling dashboards
- Fast to load, even on real data volume

Self-service BI
The setup that lets business teams answer their own questions without filing a ticket to data. We model the data and build the guardrails so self-serve does not turn into forty conflicting versions of the truth.
- Business teams answer their own questions
- Governed models, so self-serve stays consistent
- Fewer tickets to the data team, not more chaos

Executive and operational reporting
The reports leadership actually reads: the KPIs that matter, refreshed automatically, with the one number per metric that everyone agrees on. No more three teams bringing three different revenue figures to the same meeting.
- KPIs leadership agreed on, refreshed automatically
- One revenue number, one churn number, company-wide
- Scheduled delivery, no manual spreadsheet assembly
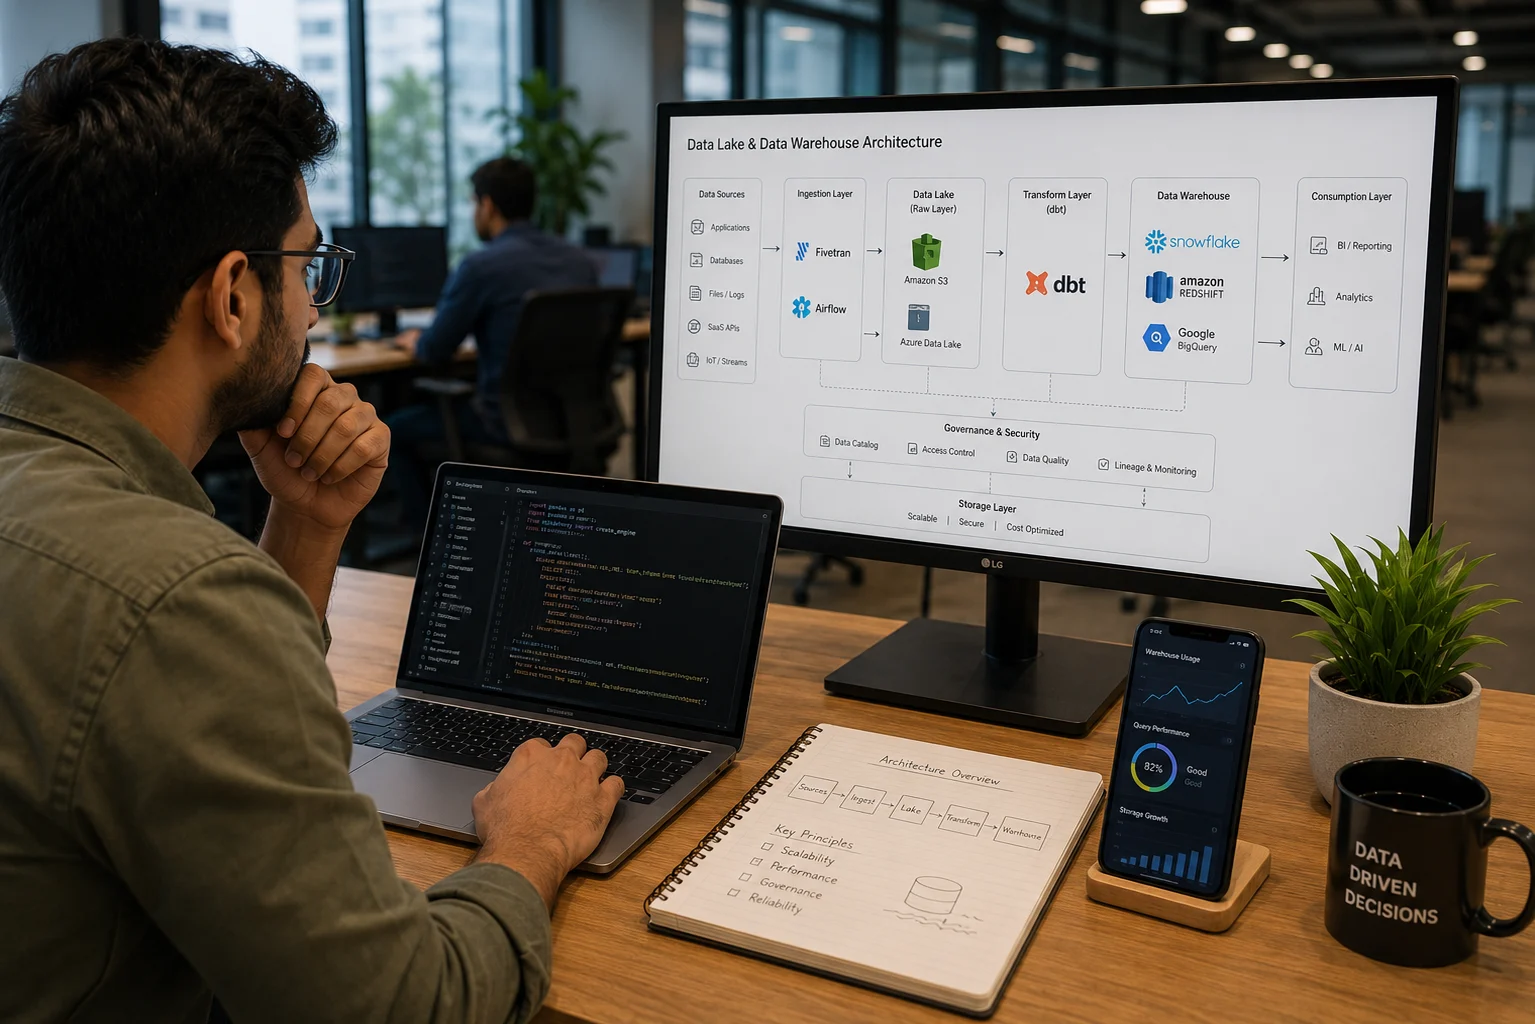
Data modeling and semantic layer
The layer between your warehouse and your dashboards that defines what every metric means. This is why the numbers agree. We build it so a metric is defined once and used everywhere, not redefined in every report.
- Metrics defined once, used everywhere
- The reason your dashboards finally agree
- Built on your warehouse, governed and documented