Businesses have more data than ever, but getting useful answers from that data can still take too long. A simple question about sales, customers, or operational performance may require a request to an analyst or IT team, followed by waiting for the right report or dashboard to be created.
Self-Service BI changes that workflow by giving business users the ability to explore data, create reports, and build dashboards on their own, without relying on technical teams for every analysis. But self-service does not mean giving everyone unrestricted access to data. The most effective approach combines user autonomy with trusted data, clear governance, and the right BI platform.
In this guide, we’ll explain what Self-Service BI is, how it works, its benefits and use cases, the challenges businesses need to consider, and the best practices for implementing it successfully.
What Is Self-Service BI?
Self-Service BI is an approach to business intelligence that allows business users to access, explore, analyze, and visualize data without depending on data analysts or IT teams for every report or query. Instead of waiting for a technical team to build a new report, users can work with available, governed data to answer their own business questions and uncover insights.
A self-service business intelligence environment typically gives users tools to connect to approved data sources, filter and explore information, create visualizations, build dashboards, and generate reports. The goal is not to make every employee a data expert. It is to make routine analysis accessible to the people closest to the business problem.
How Does Self-Service BI Work?
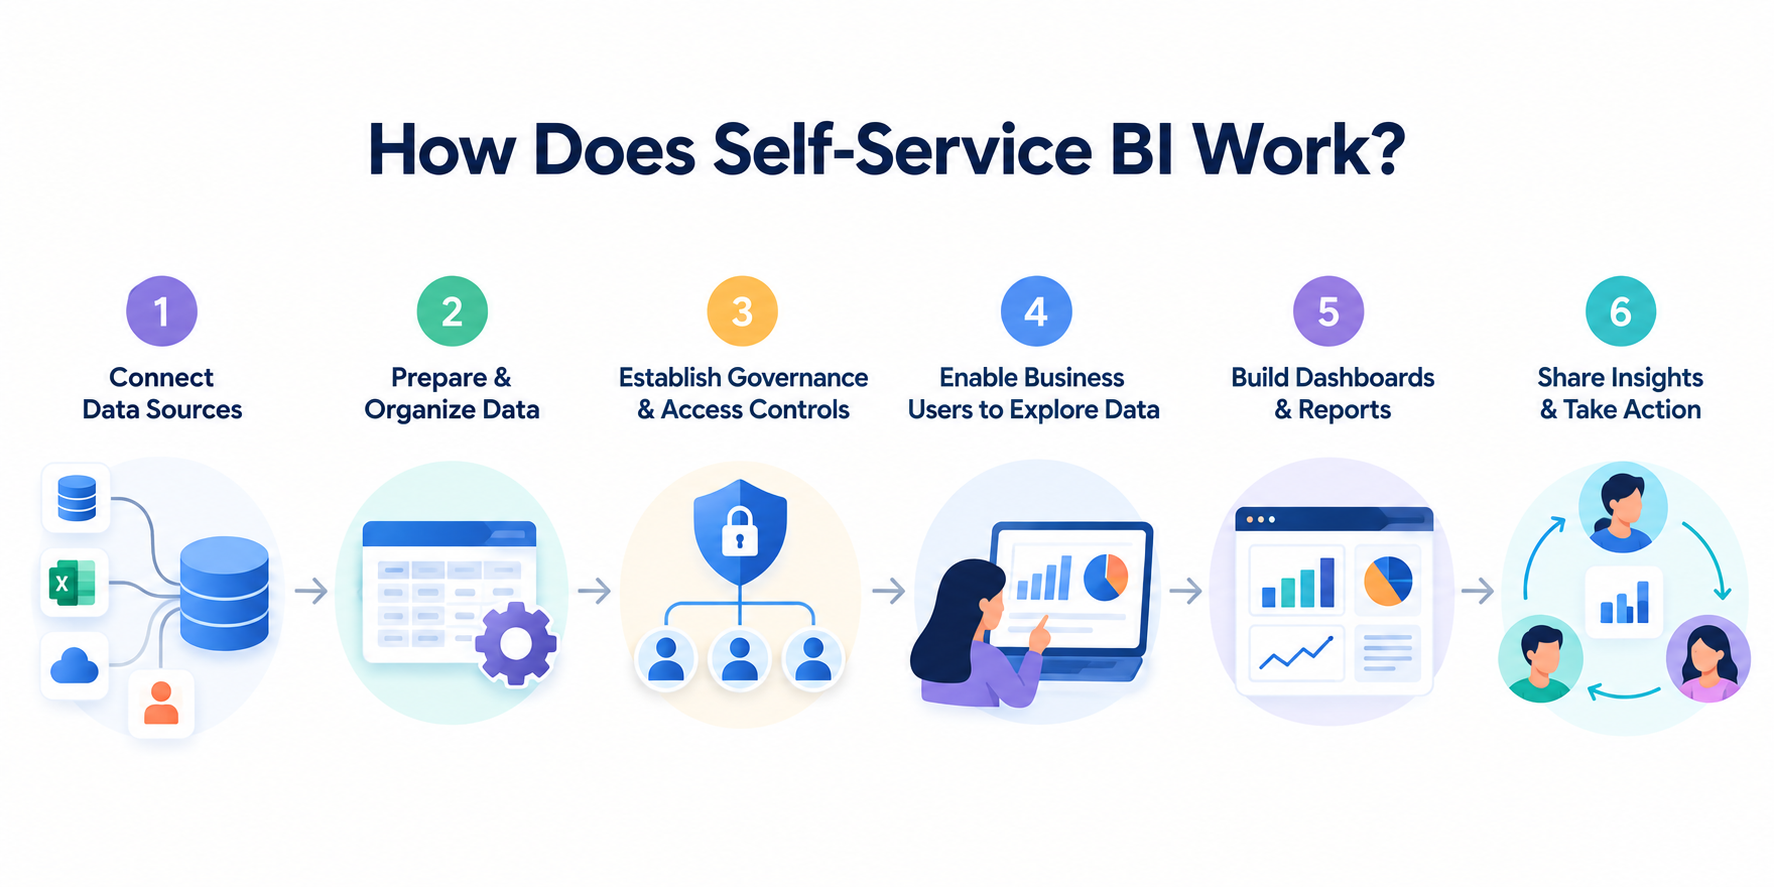
Self-Service BI works by giving business users access to trusted data through a BI platform where they can explore information, create visualizations, and answer business questions independently. While users handle much of the analysis themselves, data and IT teams typically remain responsible for preparing the data, managing access, and maintaining governance.
The process generally involves the following steps:
1. Connect Data Sources
The first step is bringing relevant data into the BI environment. Depending on the organization, this can include data from CRM and ERP systems, databases, spreadsheets, cloud applications, and other business systems. Data pipeline development helps organizations move and integrate this information so it can be prepared for downstream analysis.
Data may need to be integrated from multiple sources so users can analyze related information in one place instead of manually combining datasets.
2. Prepare and Organize the Data
Raw data is rarely ready for business analysis. It may contain duplicates, inconsistent formats, missing values, or different definitions for the same metric.
Data Teams typically clean, transform, and organize the data before making it available to business users. This creates a more reliable foundation for self-service analysis and reduces the risk of users drawing conclusions from inconsistent information.
3. Establish Governance and Access Controls
Self-service does not mean that every user should have unrestricted access to company data. Organizations need rules around who can access specific datasets, how sensitive information is protected, and which metrics or data sources are approved for reporting.
Governance also helps establish consistent definitions for important KPIs, so different teams do not create conflicting versions of the same metric.
4. Enable Business Users to Explore Data
Once trusted data is available, users can work with it through a self-service BI tool. They can filter datasets, drill into specific segments, compare trends, investigate anomalies, and perform ad hoc analysis without submitting a request for every new question.
This is where self-service BI changes the traditional workflow. Instead of waiting for a report to be created, a sales manager, marketer, finance professional, or operations leader can investigate many routine questions independently.
5. Build Dashboards and Reports
Users can turn their analysis into interactive dashboards and reports that make important information easier to understand and share. They can select relevant metrics, create visualizations, and organize information around specific business goals. Following data visualization best practices can also help users present insights clearly and avoid unnecessary or misleading visualizations.
Good dashboard design still matters here. A self-service platform can make creating charts easier, but users need to know how to present information clearly and avoid misleading or unnecessary visualizations.
6. Share Insights and Take Action
The final step is using the analysis to support decisions. Users can share dashboards and reports with colleagues, discuss findings, identify opportunities or problems, and take action based on the information.
This creates a collaborative BI model: data and IT teams provide the trusted data, infrastructure, security, and guardrails, while business users take greater ownership of analysis and decision-making.
Self-Service BI vs Traditional BI
The main difference between Self-Service BI and traditional BI is who is responsible for analyzing and reporting on data. Traditional BI typically relies on centralized BI, IT, or data teams to prepare data and create reports, while Self-Service BI gives business users more control over exploration and analysis.
|
Self-Service BI
|
Traditional BI
|
|
Business users can analyze data independently
|
Analysis is primarily handled by BI or IT teams
|
|
Designed for ad hoc questions and exploration
|
Often focused on standardized, recurring reports
|
|
Faster access to insights
|
Reports may require more time to develop
|
|
Users can create and modify dashboards
|
Technical teams typically build and maintain dashboards
|
|
Requires strong governance to prevent inconsistent analysis
|
Governance is generally more centralized
|
|
Reduces routine reporting requests to technical teams
|
Technical teams handle a larger share of reporting requests
|
Traditional BI remains valuable when organizations need highly controlled reporting, complex data models, or standardized reports for regulatory and executive use. Self-Service BI is more useful when teams need to explore data quickly and answer questions that may not have been anticipated when reports were initially designed.
In practice, organizations do not have to choose one approach over the other. A strong BI environment often uses traditional BI for governed, enterprise-wide reporting and Self-Service BI for flexible exploration and departmental analysis. This gives business users more autonomy without removing the oversight and technical expertise provided by BI and data teams.
Benefits of Self-Service BI
The biggest advantage of Self-Service BI is that it moves routine data analysis closer to the people making business decisions. Instead of depending on technical teams for every report or question, business users can work with data directly and turn it into actionable insights.
1. Faster Data-Driven Decision-Making
When users can access and analyze data themselves, they spend less time waiting for reports and more time acting on insights. Teams can investigate changes in performance, identify trends, and respond to emerging opportunities or problems faster.
2. Reduced Dependence on IT and Analysts
Self-Service BI reduces the number of routine reporting and analysis requests that need to go through IT or centralized BI teams. Technical teams can focus on more complex data, infrastructure, and strategic initiatives while business users handle everyday analysis independently.
3. Greater Access to Business Data
Self-service analytics makes relevant data accessible to more people across an organization. Sales, marketing, finance, and operations teams can work with information relevant to their responsibilities instead of relying exclusively on a small group of analysts.
4. More Flexible Ad Hoc Analysis
Not every business question can be predicted in advance. Self-Service BI allows users to investigate new questions, filter data from different perspectives, and drill into specific segments without waiting for a new report to be developed.
5. Improved Data Literacy
Regular interaction with data can help employees become more comfortable interpreting metrics, identifying trends, and using evidence in their decision-making. Over time, this can contribute to a stronger data-driven culture across the organization.
6. More Consistent and Collaborative Decision-Making
When teams can work from trusted and shared data, discussions can move away from competing spreadsheets and assumptions toward a common view of business performance. Shared dashboards and reports also make it easier for teams to communicate findings and collaborate around the same metrics.
Common Self-Service BI Use Cases
Self-Service BI can be applied wherever business teams need to explore data, monitor performance, or answer questions without waiting for a custom report. Common use cases span departments such as sales, marketing, finance, and operations.
1. Sales and Revenue Analysis
Sales teams can use Self-Service BI to monitor revenue, sales targets, pipeline performance, conversion rates, and regional results. Managers can drill into individual products, territories, or sales representatives to identify what is driving performance.
2. Marketing Analytics
Marketing teams can analyze campaign performance, lead generation, customer acquisition, and channel effectiveness. Instead of relying solely on predefined reports, marketers can explore campaign data and compare results across different audiences, channels, and time periods.
3. Financial Analysis
Finance teams can use self-service dashboards to track budgets, expenses, profitability, cash flow, and actual performance against forecasts. Users can quickly investigate variances and drill down into the factors behind changes in financial performance.
4. Operational Performance
Operations teams can monitor KPIs such as productivity, resource utilization, order volumes, inventory levels, and process performance. Self-service analysis makes it easier to identify bottlenecks and investigate operational changes as they occur.
5. Customer Analytics
Customer-facing teams can analyze customer behavior, engagement, retention, satisfaction, and support activity. By exploring these metrics independently, teams can identify patterns and uncover areas where customer experiences could be improved.
6. Executive and Management Reporting
Executives and managers can use interactive dashboards to monitor high-level KPIs and drill into areas that require attention. Rather than relying only on static reports, decision-makers can explore the underlying data and gain more context before taking action.
What to Look for in a Self-Service BI Tool
The right self-service BI tool should make data analysis accessible to business users without sacrificing security, governance, or scalability. When evaluating platforms, consider these key capabilities:
- Ease of use: Users should be able to explore data, create visualizations, and build reports without advanced technical or coding skills.
- Data connectivity: Look for integrations with the databases, cloud applications, spreadsheets, CRM systems, and other business platforms your organization already uses.
- Data visualization and dashboards: The platform should offer flexible visualization options, interactive dashboards, filtering, and drill-down capabilities so users can explore the metrics relevant to their roles.
- Governance and security: Role-based access, permissions, secure data handling, and consistent metric definitions are essential for maintaining control over self-service analytics.
- Scalability: The platform should support growing data volumes, users, and analytical requirements as self-service BI expands across the organization.
- Collaboration and sharing: Users should be able to share dashboards, reports, and insights with relevant teams and stakeholders.
- AI and advanced analytics: Features such as natural-language queries and automated insights can make data exploration easier, provided they are built on a reliable and governed data foundation.
The best self-service BI tool is ultimately one that balances usability with your organization's requirements for data quality, security, governance, and scale. For a broader comparison of leading platforms, see our BI Tools Comparison.
Self-Service BI Best Practices
Successful Self-Service BI requires more than giving employees access to a BI platform. Organizations need to create an environment where users can work independently while the underlying data remains accurate, secure, and consistent.
1. Start With Clear Business Questions
Self-service analytics should begin with the decisions the business needs to make, not with the data or features available in a BI platform. Identify the questions teams need to answer and the KPIs they need to monitor before building dashboards or opening access to datasets.
2. Build a Trusted Data Foundation
Business users can only produce reliable insights when they are working with reliable data. Data should be cleaned, integrated, and structured before it is made available for self-service analysis. A strong data foundation also reduces the need for users to reconcile information from multiple sources themselves.
3. Establish Data Governance
Self-service BI needs clear rules around data ownership, access, security, and usage. Establishing data governance frameworks helps ensure users can explore data independently without creating unnecessary security risks or inconsistent reporting.
4. Standardize Metrics and KPIs
Different teams should not have their own definitions of fundamental metrics such as revenue, conversion rate, or customer retention. Establishing shared definitions and trusted data sources helps ensure that dashboards across the organization tell a consistent story.
5. Use Role-Based Access Controls
Not every employee needs access to every dataset. Role-based permissions allow organizations to provide users with the information relevant to their responsibilities while protecting sensitive or restricted data.
6. Keep Dashboards Focused
Self-service platforms make it easy to create dashboards, but more charts do not necessarily mean better insights. Dashboards should focus on the metrics and trends that matter to a specific audience or business decision. Applying data visualization best practices can make self-service reports easier to understand and act on.
7. Develop Data Literacy
Users need more than technical knowledge of the BI platform. Training should help them understand data sources, interpret metrics correctly, identify misleading patterns, and recognize the limitations of their analysis. Stronger data literacy leads to more responsible use of self-service analytics.
8. Monitor Adoption and Improve
Self-service BI should evolve with the organization. Monitor which dashboards and datasets users rely on, collect feedback, identify gaps, and remove outdated or redundant content. Continuous improvement helps keep the BI environment useful as business requirements change.
Conclusion
Self-Service BI gives business teams greater control over how they access, explore, and use data. Instead of relying on technical teams for every report or analytical question, users can investigate data, build dashboards, and uncover insights when they need them.
But successful self-service analytics depends on more than choosing the right platform. Organizations need trusted data, strong governance, appropriate access controls, consistent metrics, and users who understand how to work with data effectively.
The goal is not to remove IT or data teams from the BI process. It is to create the right balance: technical teams provide the data foundation and guardrails, while business users gain the freedom to turn that data into timely decisions. When implemented this way, Self-Service BI can make analytics faster, more accessible, and more valuable across the organization.