You want to launch an AI pilot next quarter. A data maturity model would tell you whether your data can support it. Most teams skip that check. Then finance and sales report different revenue numbers for the same month. The pilot stalls before it starts.
The gap usually sits upstream. Pipelines fail without anyone noticing. No one owns the customer table. Quality checks run once a quarter, if at all.
Knowing your maturity level shows you which of these problems to fix first. It also keeps your enterprise data strategy grounded in what your team can deliver today.
This guide walks through the five stages of data maturity and the dimensions behind each one. You will also learn how to run an assessment and turn the results into a roadmap.
A data maturity model is a framework that measures how well your organization collects, manages, and uses data. You will also see it called a data maturity framework. It places your organization at one stage on a scale. Each stage describes what data practices typically look like at that level.
Most models use five data maturity levels. The structure borrows from the Capability Maturity Model. Software teams have used that model since the early 1990s. At the bottom, reports live in spreadsheets and nobody trusts the numbers. At the top, data is automated, governed, and used in everyday decisions.
A good model also scores each area of your data practice separately. Governance gets its own rating. So do quality, architecture, and skills. This matters because few organizations sit at one level across the board.
Teams use the results in three ways. They decide what to fix first. They justify budget to leadership with evidence instead of opinion. They measure progress against the same baseline a year later.
The 5 Stages of Data Maturity
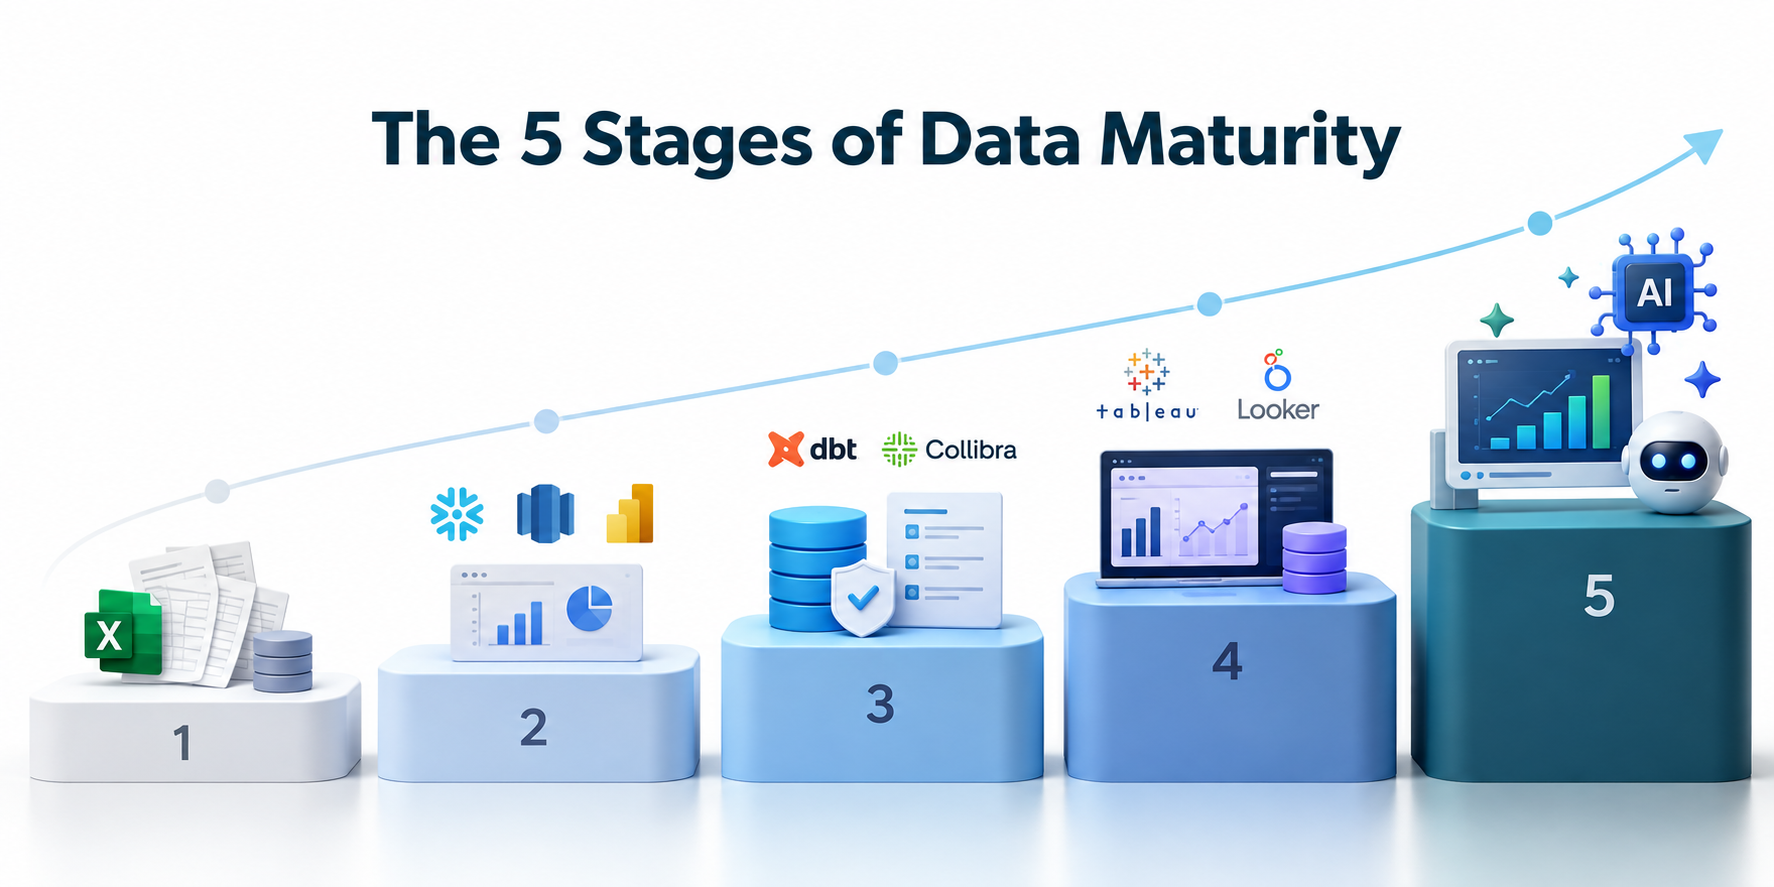
Most data maturity models describe five stages. Each stage reflects how data is stored, governed, and used in decisions. The data maturity levels below follow the order most organizations move through. A data maturity assessment, covered later in this guide, confirms which stage applies to each area of your data practice.
The table gives a quick comparison of all five stages.
|
Stage
|
How data is managed
|
How data is used
|
Typical data team
|
|
Initial
|
Spreadsheets and siloed applications
|
Manual, backward-looking reports
|
No dedicated team
|
|
Developing
|
First warehouse or BI tool with some scheduled pipelines
|
Standard dashboards that users still double-check
|
Small central team handling every request
|
|
Defined
|
Documented governance and agreed metric definitions
|
Consistent reporting across departments
|
Central team with named data owners
|
|
Advanced
|
Data managed as products with quality targets
|
Self-service analytics and ML in production
|
Platform team plus embedded analysts
|
|
Optimized
|
Automated monitoring and continuous improvement
|
Data and AI built into daily decisions
|
Data skills across every function
|
Stage 1: Initial
At the Initial stage, data management is informal and depends on individual effort. Data sits in spreadsheets, CRM exports, and the databases behind separate applications. No one owns data as a function. Reports get built by hand whenever someone needs a number. Each team builds its own version, so the same metric often carries several values.
You are likely at this stage if you see these patterns.
-
Monthly reports take days to assemble manually
-
Two teams bring different numbers to the same meeting
-
Knowledge of where data lives sits with one or two people
-
Data requests go to whoever happens to know the system
The move to Stage 2 usually starts with one business-critical use case. Revenue reporting and customer metrics are common starting points. Centralizing that single dataset builds the case for a broader data platform.
Stage 2: Developing
The Developing stage is where an organization starts centralizing its data. A cloud data warehouse or BI tool is usually in place. Some pipelines load data on a schedule. Dashboards cover the main business areas. Quality checks, documentation, and ownership still vary from one dataset to the next.
Trust is the main gap at this level. Users can see dashboards, but they often verify the numbers before sharing them.
You are likely at this stage if you see these patterns.
-
Teams export dashboard data to spreadsheets to check it
-
Pipelines break and get fixed only after someone complains
-
A small data team handles every request across the business
-
Different dashboards show different figures for the same metric
Progress to Stage 3 depends on standardization. Teams agree on definitions for core metrics. Critical datasets get named owners. Key pipelines get automated tests.
Stage 3: Defined
At the Defined stage, data practices are documented and applied consistently across teams. A governance program sets policies for access, quality, and ownership. Core metrics have one agreed definition. Pipelines follow shared engineering standards. A data catalog helps people find trusted datasets.
This is usually the stage where leadership starts using dashboards in planning meetings without second-guessing them.
You are likely at this stage if you see these patterns.
-
A shared data dictionary or metrics layer is in active use
-
Automated quality checks run on key pipelines
-
New reports reuse existing data models instead of starting from scratch
-
Access requests follow a defined approval process
Reaching Stage 4 requires enforcement and measurement. Policies need monitoring to confirm teams follow them. Data quality needs targets that the data team reports on regularly.
Stage 4: Advanced
At the Advanced stage, data is managed as a product with clear owners and measurable service levels. Teams track freshness, completeness, and accuracy against defined targets. Business users answer most of their own questions through self-service tools. Predictive models and early AI use cases run in production on governed data.
Cost becomes a real concern at this level. Cloud platform spend can grow faster than the value it delivers when usage goes untracked.
You are likely at this stage if you see these patterns.
-
Data SLAs are defined and monitored
-
Business teams build reports without filing tickets
-
ML models run on the same governed data as reporting
-
Platform costs are tracked by team or use case
The step to Stage 5 comes from automation and deeper integration. Monitoring and remediation run with minimal manual effort. Data and AI move from supporting decisions to shaping products and operations.
Stage 5: Optimized
At the Optimized stage, data informs decisions across the organization by default. Processes improve continuously based on usage and quality metrics. Automated systems catch and resolve most data issues before users notice them. AI models are part of core products and operations. People in every function work with data as part of their role.
You are likely at this stage if you see these patterns.
-
Data observability tools flag and route most issues automatically
-
Product and operations teams ship AI features on shared data infrastructure
-
Data investments are measured against business outcomes
-
Maturity is reassessed on a regular cycle
Very few organizations reach Stage 5 across every area of their data practice. For many mid-sized companies, a solid Stage 4 delivers most of the business value. Pushing further makes sense when data is a core part of the product itself.
Key Dimensions of a Data Maturity Framework
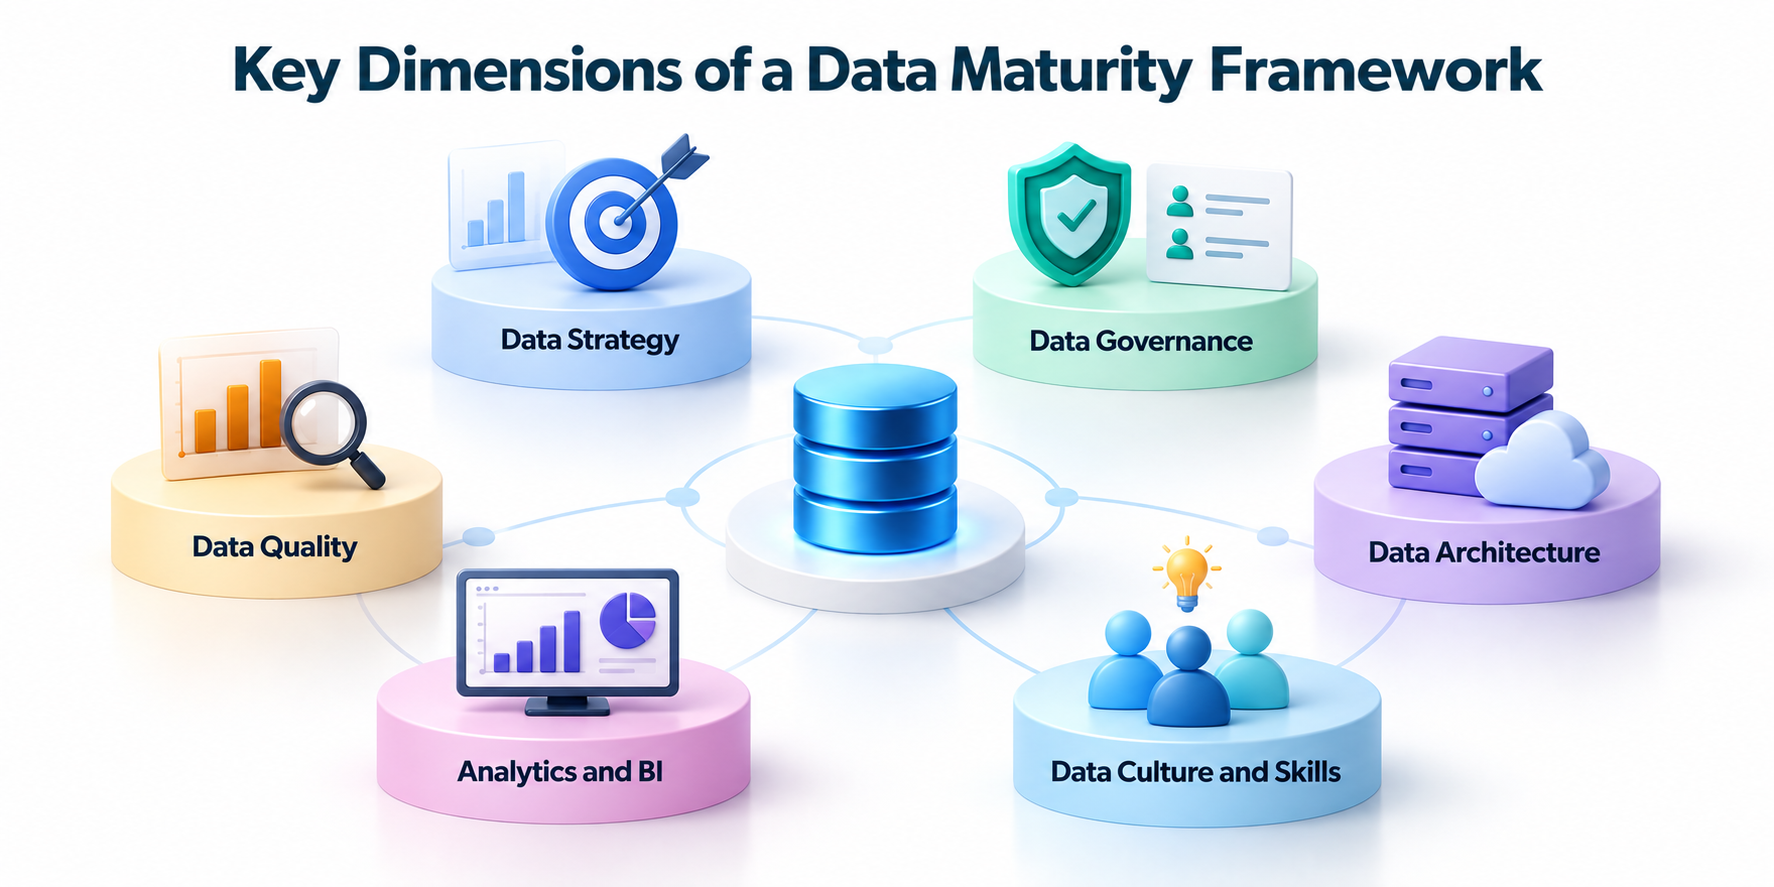
A single stage number describes your organization at a high level, but it hides where the actual gaps are. A data maturity framework scores several dimensions separately, which is why a company can sit at Stage 4 on architecture and Stage 2 on governance at the same time. The six dimensions below cover what most established frameworks measure.
Data Strategy
Strategy is the dimension that caps all the others. An organization can run a modern cloud platform, document its pipelines, and still produce work nobody asked for. That happens when data projects start from tool purchases and internal requests instead of business goals.
Mature strategy shows up in how work gets approved. Every initiative has a business sponsor outside the data team. Funding is recurring rather than negotiated project by project. Success is measured against a business outcome such as reduced churn or faster closing, not against delivery dates.
The written document matters less than whether leadership refers to it when deciding what gets built next quarter.
Data Governance
Governance covers ownership, access, standards, and compliance. It is also the most common weak spot. Plenty of organizations reach solid architecture maturity while governance sits at Stage 2, and that gap is why the same metric still carries different values in different reports.
Three things tell you where you stand:
-
Critical datasets have named owners who are accountable for definitions and quality
-
Access follows a documented approval process rather than a request to whoever has admin rights
-
Metric definitions live in one agreed place that reporting is built against
Mature data governance frameworks also define what happens when a policy is broken. Written policies without enforcement produce Stage 3 documentation on top of Stage 2 practice.
Data Quality
Quality is measured across four attributes, and maturity shows in whether each one is monitored or discovered by accident.
|
Attribute
|
What a failure looks like
|
Mature practice
|
|
Accuracy
|
Customer records with wrong or outdated values
|
Validation rules run at ingestion
|
|
Completeness
|
Null fields in records that drive reporting
|
Thresholds set per field, with alerts
|
|
Timeliness
|
Dashboards showing yesterday's data at noon
|
Freshness targets tracked against an SLA
|
|
Consistency
|
Sales and finance reporting different revenue
|
One definition applied across systems
|
A data quality framework sets thresholds for each attribute on your critical datasets, then reports against them. Without those thresholds, quality stays a matter of opinion and gets debated in meetings instead of fixed.
Data Architecture
One question reveals architecture maturity faster than any checklist. Ask what happens when the business adds a new data source.
At low maturity, someone writes a custom script, runs it manually, and documents nothing. At higher maturity, the source is added through an existing ingestion pattern, the pipeline is version controlled and tested, and monitoring picks it up automatically.
Architecture often runs ahead of the other dimensions, and that creates a false sense of progress. A modern cloud platform can be deployed in a few months. Governance and skills take years. An organization with a strong platform and weak governance will still produce conflicting reports, just faster than before.
Analytics and BI
This dimension covers what the organization does with data once it exists. The progression is straightforward.
-
Manual reporting: Analysts pull extracts and build reports by hand for each request.
-
Standard dashboards: Scheduled reports cover the main business areas, built on shared data models.
-
Self-service analysis: Business teams answer their own questions against governed datasets.
-
Predictive and automated: Models forecast outcomes and feed decisions directly, with accuracy monitored over time.
Most organizations overestimate where they sit here. A self-service tool that only five analysts use is still Stage 2 in practice, whatever the license count says.
Data Culture and Skills
Culture is the hardest dimension to fake and the slowest to move. You can see it in a planning meeting. Either someone pulls up a number to settle a disagreement, or the most senior person in the room decides.
Skills are the constraint underneath it. Business teams need enough literacy to query data and interpret what they find without a ticket to the data team. Data roles need to be defined and filled, including engineers, analysts, and stewards who own specific datasets.
Tooling changes in a quarter. Working habits across departments take a year or more, which is why culture usually lags every other dimension on the scorecard even in organizations that invest heavily in data.
How to Conduct a Data Maturity Assessment
An assessment scores your organization against the five data maturity stages, from Initial through Optimized, and it scores each dimension separately rather than as one number. Scoring comes before gap analysis, because a gap only means something once you know your baseline.
Define Assessment Criteria
Pick the framework first. Adopt an established model such as CMMI DMM or DAMA-DMBOK, or build a scorecard from the six dimensions above.
Then write one line describing what each stage looks like per dimension. Governance at Stage 2 (Developing) might read "ownership exists for some datasets but is not documented." Without those descriptions, two people scoring the same dimension will land in different places.
Keep the scope tight. Assessing the whole enterprise at once produces an average that describes nobody.
Evaluate Each Data Capability
Score from three sources. Interviews tell you how people believe things work. System evidence, meaning pipeline inventories, access logs, and incident history, tells you how things actually work. Documentation tells you what was intended. They will disagree. When they do, the system evidence wins.
Determine Your Current Maturity Level
Score each dimension against the five stages, then record the results as a profile rather than an average.
A company at Stage 4 (Advanced) on architecture and Stage 2 (Developing) on governance is not a Stage 3 organization. It runs an Advanced platform on Developing-stage controls, and the average hides that finding entirely.
Two rules keep scores honest. Score what runs in production today, not what is planned. And when a dimension sits between stages, record the lower one.
Identify Maturity Gaps
A gap is the distance between a dimension's current stage and the stage the business needs. That target is rarely Stage 5 (Optimized). A regional logistics firm may need Stage 3 (Defined) governance and Stage 4 (Advanced) architecture.
Set targets from commitments already made. A planned AI initiative sets a floor for quality and architecture. Data residency rules set a floor for governance.
Then split the gaps. Blocking gaps stop other work, and governance usually falls here because quality and self-service both depend on clear ownership. Improvement gaps raise the value of what already runs.
How to Build a Data Maturity Roadmap
A data maturity roadmap turns assessment results into sequenced work. The four steps below stay deliberately close to the maturity model, since the sequencing logic comes from the stages themselves.
Define Your Target Maturity Level
Set a target per dimension, not one number for the organization. Architecture might need Stage 4 (Advanced) while governance needs Stage 3 (Defined), depending on what the business has committed to.
Attach a date to each target. A stage takes six to eighteen months to move through, so a three-year roadmap with no interim checkpoints is a wish list.
One constraint worth respecting. Dimensions cannot be moved more than one stage at a time, because each stage depends on the practices built in the one before it.
Prioritize Capability Gaps
Blocking gaps come first. If governance sits below quality and analytics, fixing dashboards produces trusted-looking reports built on unowned data.
Sequence the rest by what unlocks the most downstream work rather than by what scores lowest. A Stage 2 culture score looks alarming, but literacy training has little effect while the underlying data is still unreliable.
Leave culture and skills running alongside everything else rather than scheduling them as a phase. They move slowest.
Create Improvement Initiatives
Convert each prioritized gap into a scoped initiative with an owner, a budget, and a defined outcome. "Improve data governance" is not an initiative. "Assign owners and document definitions for the twelve datasets behind executive reporting, by end of Q2" is.
This is where a data strategy framework does the heavy lifting, since it maps initiatives to business objectives and tells you which ones deserve funding first.
Expect roughly a third of the effort to go to work with no visible output, such as documentation, testing, and access controls. Skipping it is how organizations land at Stage 4 architecture with Stage 2 governance.
Track Progress Over Time
Rescore the assessment on a fixed cycle, typically every six to twelve months, using the same criteria as the baseline. Changing the scorecard between rounds makes the comparison meaningless.
Between rescores, track operating metrics that move faster than stage scores. Pipeline failure rates, time to fulfil a data request, percentage of critical datasets with named owners, and self-service adoption all shift within a quarter.
Report both to leadership. Stage movement justifies continued investment, and the operating metrics show whether the current quarter's work is landing.
Data Maturity Model vs. Data Strategy
These two get used interchangeably, and they do different jobs.
| |
Data maturity model
|
Data strategy
|
|
Purpose
|
Measures current capability
|
Defines intent and direction
|
|
Question it answers
|
Where do we stand today
|
What should we do with data and why
|
|
Output
|
A score per dimension
|
A prioritized plan with owners and funding
|
|
Time frame
|
A snapshot, rescored periodically
|
Forward-looking, usually annual
|
|
Owner
|
Data leadership, often with external input
|
Executive leadership with the data team
|
The relationship runs one way in practice. The assessment tells you where you stand, and the strategy decides what to do about it. Running the assessment first means the strategy is built on evidence instead of assumptions about what the data team can already deliver.
You can have one without the other, and both failure modes are common. A strategy written without an assessment sets targets the organization cannot reach, which is how AI initiatives get approved on top of data nobody owns. An assessment without a strategy produces a scorecard that circulates once and changes nothing, because no budget or owner is attached to the gaps it found.
Most organizations run the assessment every six to twelve months and revisit the strategy annually. The assessment feeds the strategy review.